- Oct 08, 2020
 0
0- by A2 Support Team
Sometimes, it can be a real challenge to monitor your website’s performance. You have to keep track of important metrics such as the speed of your site and its ability to respond to user interactions. This data can then be used to decrease loading times and reduce bounce rates.
Poor web performance may be caused by a lot of factors, from large file sizes to outdated software, and has a negative impact on site usability. As such, it’s crucial to stay on top of your website’s speed. Fortunately, there are many web monitoring platforms that can simplify the process for you.
In this article, we’ll discuss three prominent platforms for monitoring your site’s performance, and show you how to get started with each. Let’s get to work!
Why It’s Important to Measure Your Website’s Performance
Web performance monitoring enables you to measure your website’s speed, and find ways to make it faster. For example, you can use web monitoring tools to receive feedback on which elements are taking too long to load. These solutions can also help you resolve any issues you discover.
If you’re running an online business, having a slow website will likely turn people away from your brand. After all, studies have shown that 40 percent of customers abandon a website that takes longer than three seconds to load. You’ll likely struggle to drive conversions if people are dissatisfied with the experience your site provides.
Unfortunately, web performance can degrade over time, whether due to technical causes or simply an accumulation of content. That’s why it’s important to monitor your website regularly instead of just testing it at launch. The goal is to understand how web browsers work, and in turn create an outstanding user experience.
3 Platforms for Monitoring Your Website’s Performance
Although there are many automated tools to choose from, it may be difficult to find one that suits your website’s needs. To help you deliver the best possible user experience, here are three platforms you can use to monitor your site’s performance.
1. Google PageSpeed Insights
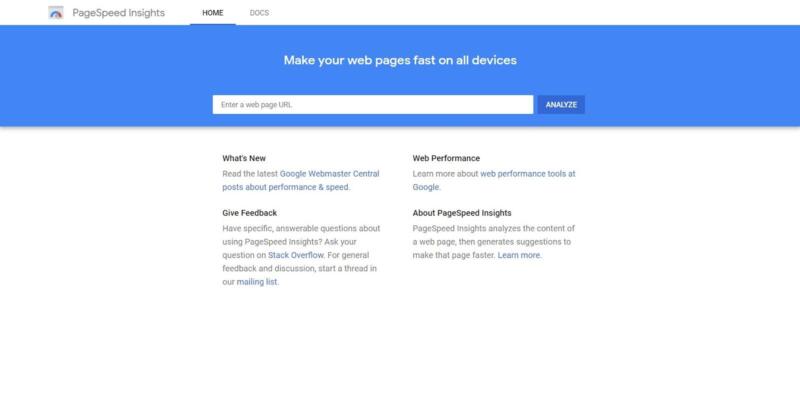
Google PageSpeed Insights (PSI) is a platform for evaluating performance on both desktop and mobile devices. PSI offers suggestions for improving page loading speed by collecting data from multiple sources, and then converting those metrics into an overall performance score.
To evaluate your website, head over to the PSI home page. In the Search bar, paste the first URL that you want to examine, and click on Analyze. PSI will then generate a report for the provided URL:
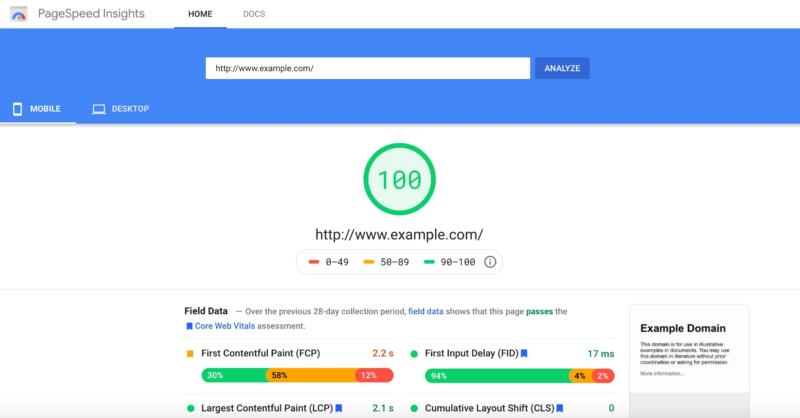
The PageSpeed Insights report is divided into two tabs. The Mobile tab details how the URL performs on mobile devices, while the Desktop tab rates it on desktops and laptops.
Both of these tabs contain Field and Lab data. Field data is based on the website’s historical performance. By contrast, Lab data is based on a simulated load of the page on a single device, and a fixed set of network conditions. It’s possible that your Field data and Lab data may differ, so you should review the information in both tabs.
Both the Desktop and Mobile tabs also contain data for the following metrics:
- First Contentful Paint (FCP). When a visitor navigates to your website, FCP describes how long it takes the browser to render the first piece of Document Object Model (DOM) content. Images, non-white canvas elements, and Scalable Vector Graphics (SVGs) are all considered DOM content. You can often improve your FCP score by reducing your font load times.
- First Input Delay (FID). There are many ways that a visitor may interact with your website, such as clicking on a link or tapping a button. The FID is the amount of time it takes the browser to respond to that interaction. A significant FID often indicates that the browser’s main thread is busy performing some other task. To optimize your FID, you can try reducing the duration of your longest tasks, or optimizing your JavaScript.
Largest Contentful Paint (LCP). LCP reports the render time of the largest image, video, or text visible within the viewport. This metric attempts to measure perceived loading speed, as it’s assumed that your page’s main content is also the largest element. There are several ways you can optimize LCP, including by optimizing your CSS, JavaScript, and web fonts.
Cumulative Layout Shift (CLS). This measures unexpected layout shifts, which occur when a visible element changes its start position from one rendered frame to the next. You can use this measurement to quantity how often users experience these shifts when waiting for your website to load. You can optimize CLS by providing size attributes for all of your images and videos.
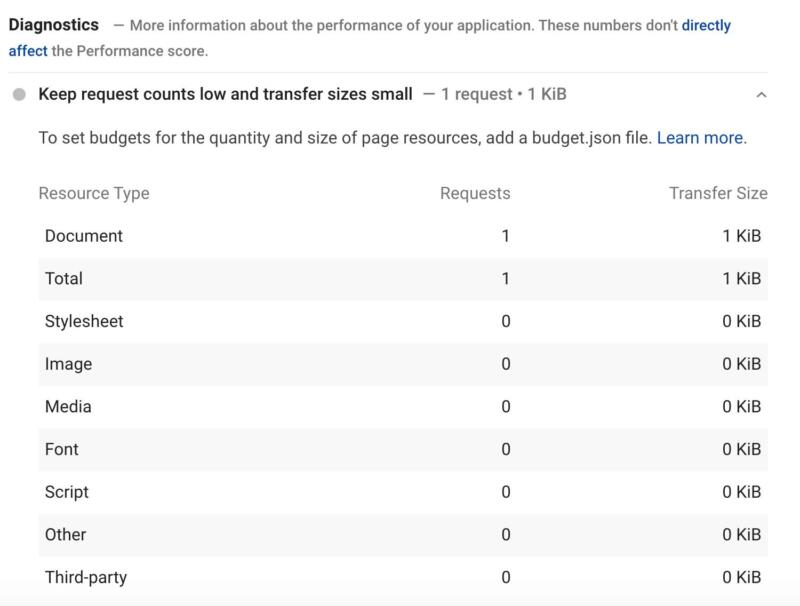
The PSI report also features a Diagnostics section. This section provides recommendations for best practices that could improve your page’s performance:
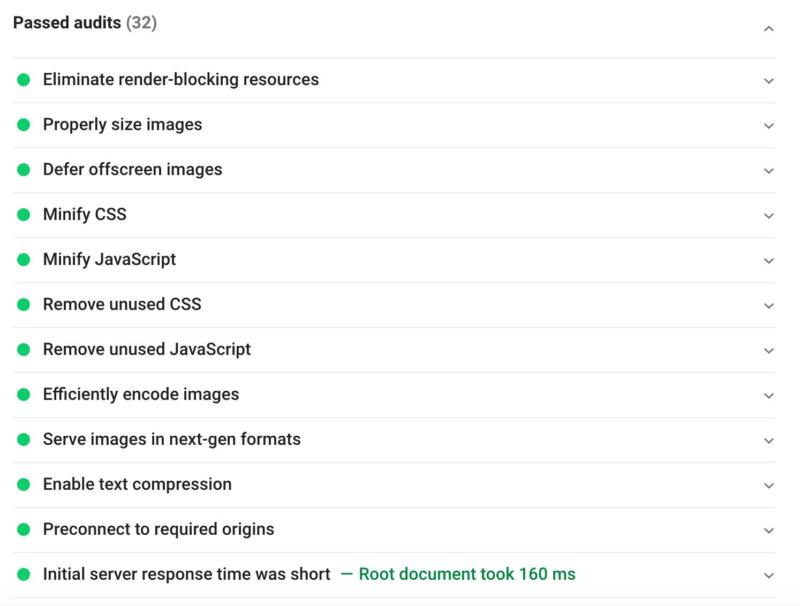
You’ll also find a Passed Audits section, which lists all the performance checks that your URL passed successfully:
If you need to test a particularly large website or produce custom reports, PSI also provides a full API interface. You can use this to automatically extract all the data from Google’s PSI, and display it as part of your own reports and applications.
The PSI API requires an API key. To generate this, head over to the PageSpeed Insights API page and select Get a key. You can then either create a new project, or add your key to an existing project.
2. Pingdom
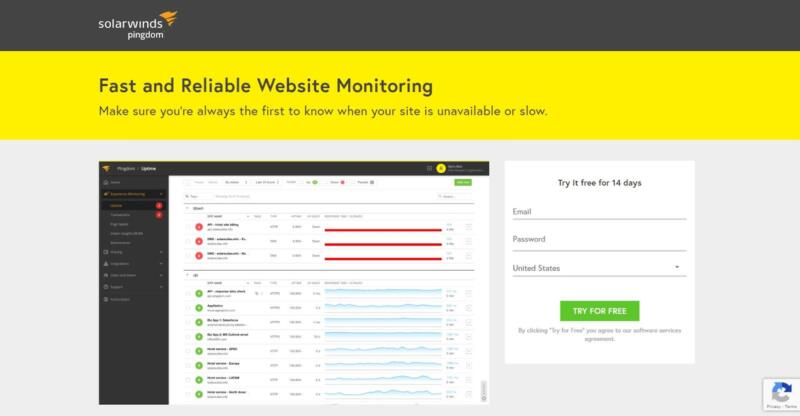
Pingdom by SolarWinds is another platform you can use to test your website. This web monitoring service is an affordable option for end users, with built-in Synthetic and Real User Monitoring to imitate visitor interactions so you’ll be notified in case your site goes down.
Pingdom makes it easier to troubleshoot your web page while you conduct a thorough analysis. It also lets you know who’s visiting your site and what browsers they’re using. Another useful tool is uptime monitoring, for testing the availability of your site’s applications and servers.
If you’re curious about Real User Monitoring, it contains key features such as location live mapping, visible performance trends, and advanced filtering for gathering insights on your most valued customers. In terms of pricing, both monitoring plans cost $10.00 per month.
Pingdom is ideal for webmasters and web developers, being a cost-effective platform for measuring uptime and performance. To explore what Pingdom has to offer, you can purchase a subscription or sign up for a free 14 day trial.
When you sign up for Pingdom, you can enter the website that you want to monitor. After a few moments, you should see the Pingdom dashboard:
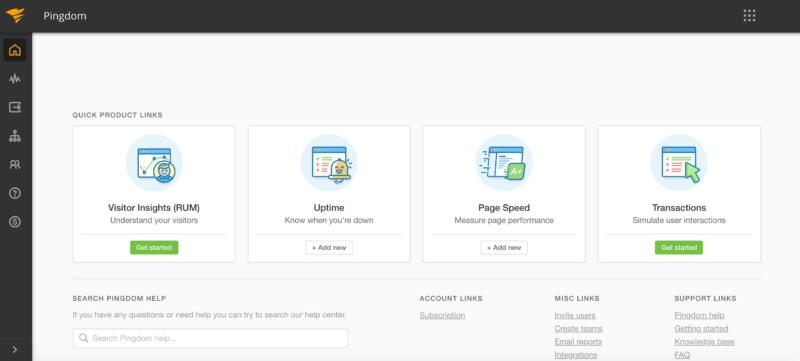
You can use this platform to set up checks, which will run specific tests at an interval specified by you. Let’s look at how you can create a basic uptime monitoring check, which will send a notification if your website experiences downtime.
In the left-hand menu, select Experience Monitoring > Uptime. You can then choose Add new:

First, you’ll want to give your check a name. You can then specify how frequently Pingdom should test your website or server uptime, ranging from every minute to once per hour:
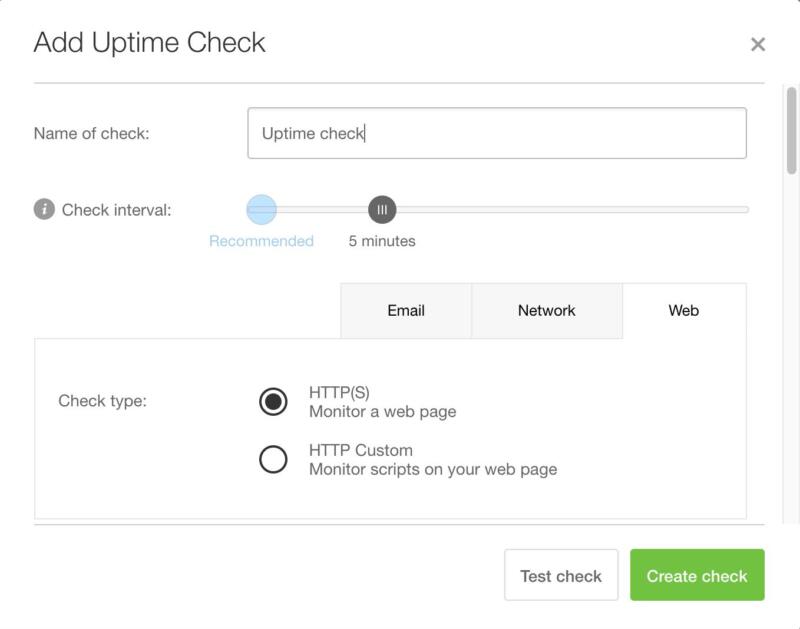
In Check type, you can choose the checks that you want Pingdom to perform, such as email server, network server, or website URL.
Then, under URL/IP, enter the URL of the website that you want to monitor. Make sure you specify whether the URL in question uses HTTP or HTTPS. In addition, by default Pingdom tests your uptime from server clusters in Europe and North America. You can specify an alternative region if required.
If your website does go down, then you’ll want to know about it! So make sure you’re set up to receive notifications about any incidents that occur with the check. We’ll show you how to add more contacts shortly.
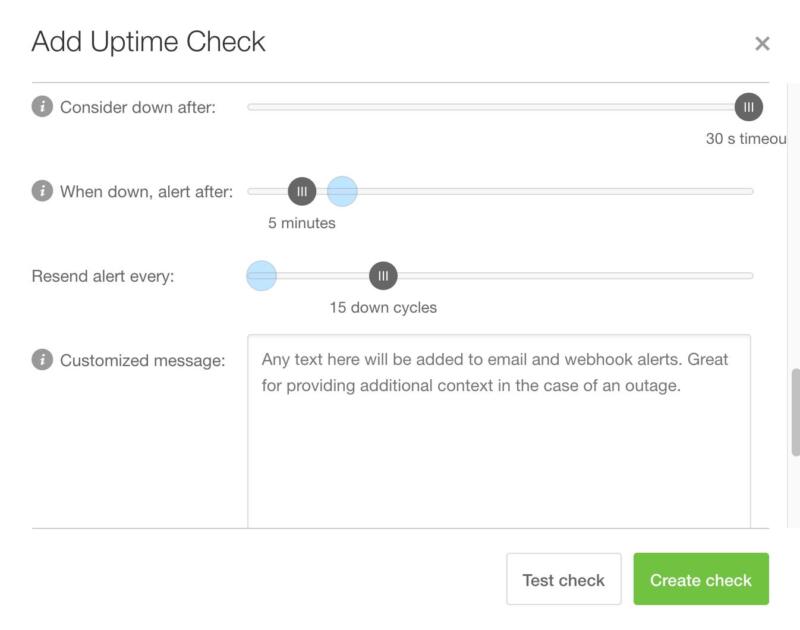
In the Consider down after section, you can specify how long the URL should be unreachable for before Pingdom sends you a notification. You’ll typically want to avoid setting this value to Instantly, so that Pingdom doesn’t notify you about every disruption to your service.
You may also want to resend the alert throughout the duration of the downtime. To create follow-up alerts, use the Resend every slider:
Pingdom can even notify you when your website comes back online. To receive this notification, make sure that the Alert when back up checkbox is selected.
There are some additional settings that you may want to explore, but this is all you need to create a functioning uptime check. At this point, you can click on Create check. Your uptime check will start running, and will appear on your Pingdom dashboard:
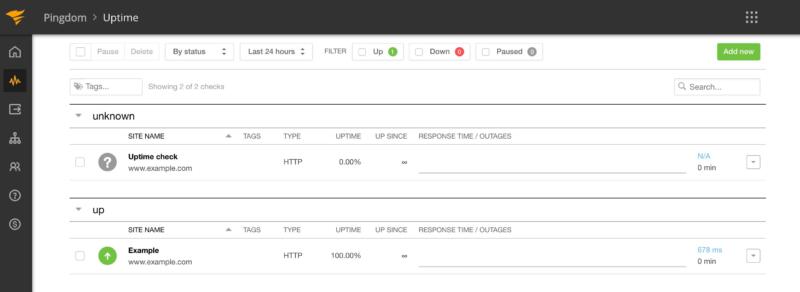
Once you’ve created a check, you can add more contacts to it. Additional contacts can be useful when you’re out of the office, and ensure that there’s someone responding to Pingdom alerts across all time zones.
In Pingdom’s left-hand menu, select Users and teams > Users. You can then add more people to your account by selecting Add user.
First, specify whether this person should be added as an Admin, Editor, or Viewer. Alternatively, you can add someone as a Contact, which means they’ll only receive alerts. On the subsequent screen, enter the person’s information, and then click on Add user.
After creating an additional user, you can add this person to your uptime check. In Pingdom’s left-hand menu, select Experience monitoring > Uptime. Find the check that you just created, and click on its accompanying Arrow button:
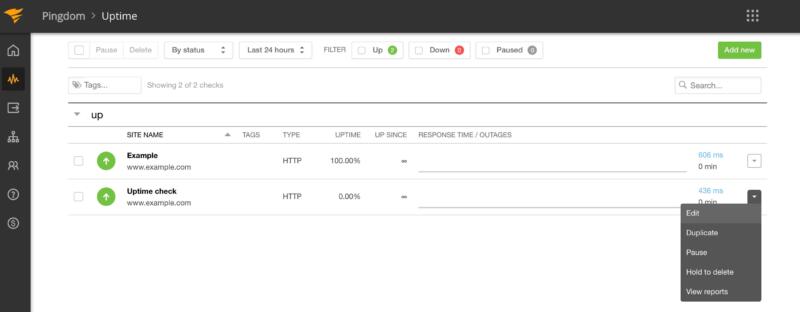
You can now select Edit. On the subsequent screen, scroll down to the Who to alert section. You should see the user you just created. To add this person to your check, select their accompanying checkbox and then click on Modify check.
Now, everyone who’s added to this check will be notified if your website goes offline. You can use Pingdom to create a wide range of additional performance checks, including page speed checks, transaction checks, and visitor insights.
3. GTmetrix
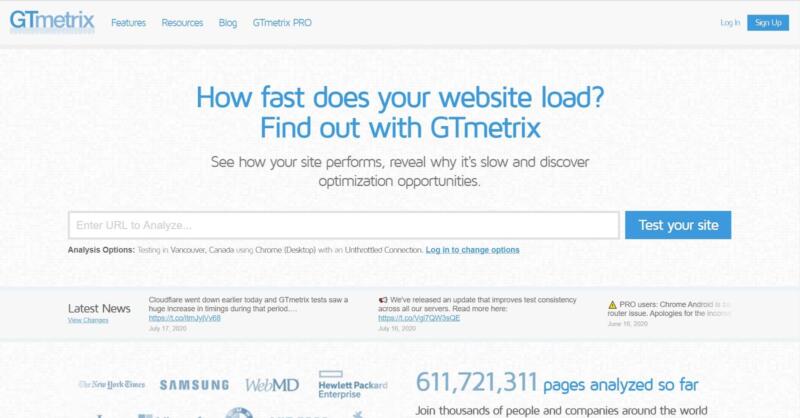
If you prefer a detailed breakdown of your website’s performance, then GTmetrix is the way to go. This platform offers real-time performance tracking, by scheduling your page tests and summarizing the results in a graph displaying specific loading metrics.
One major benefit of using GTmetrix is the ability to test a page in different browsers, networks, and even countries. With GTmetrix, you’ll also be able to preview how your pages appear on various screen sizes, including iPhones and tablets.
To see how well your site is performing, simply head over to the GTmetrix home page and enter your site’s URL. Depending on how many people are currently using the platform, you may need to wait a few minutes. GTmetrix will then generate a detailed report on your website’s performance:
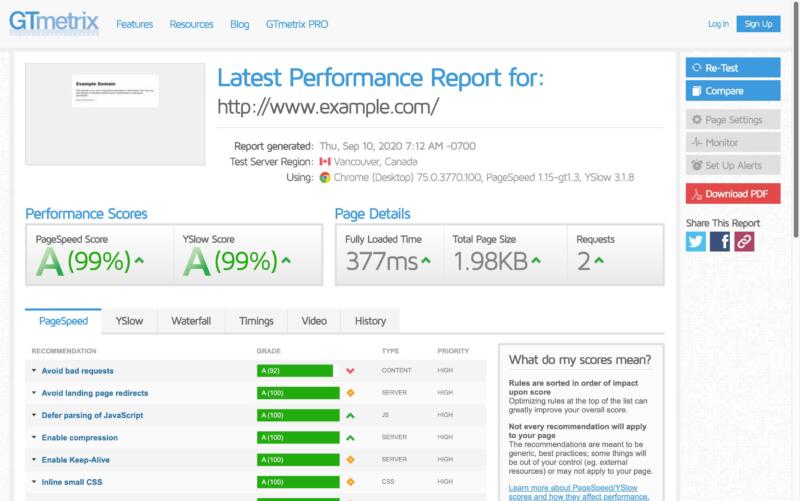
This report is divided into multiple tabs. The PageSpeed tab displays some recommendations to help you optimize your website, such as compacting your CSS code, enabling HTTP Keep-Alive, and specifying the character set at the server level.
The YSlow tab measures your website’s performance using an algorithm developed by Yahoo! Similar to PageSpeed, this tab offers suggestions for improving your page’s performance.
Next up, the Waterfall tab displays a visual representation of how every single asset on your website loads, including your CSS, HTML, JavaScript, images, plugins and third-party content. You can use the provided waterfall graph to analyze how each asset is impacting your site’s loading times:
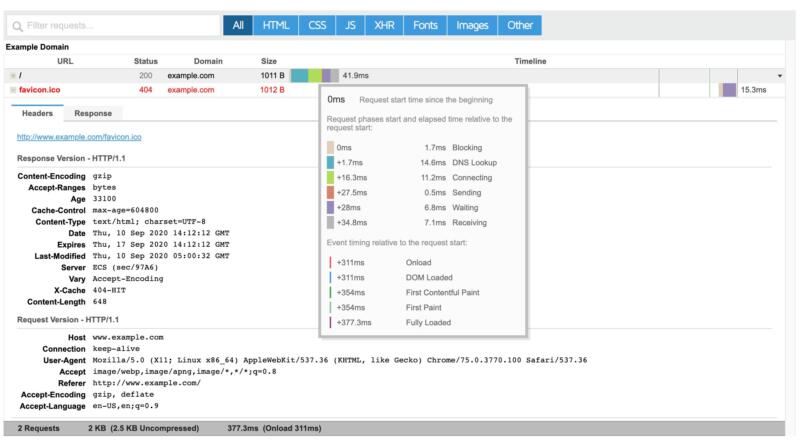
The Timings tab provides an insight into how the loading time of your page is being split. Using this tab, you can see the amount of time needed for eventual redirects, connection, back-end duration, First Paint, DOM interactive time, and more.
As for the Video tab, it enables you to pinpoint loading issues, including the exact point where bottlenecks and stoppages occur. You can use this tab to record a video of your page as it loads. Then you can slow the playback by up to four times the original speed.
This video also provides a filmstrip view, so you can see a frame-by-frame visualization of how your page loads. Within the video, you can jump to major page load milestones, including DNS resolved, First byte, and DOM loaded.
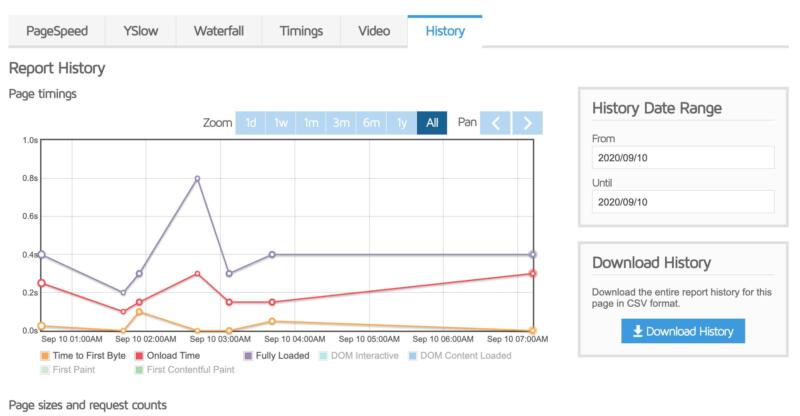
Finally, the History tab displays your page’s historical performance. Depending on how many times you’ve tested the same page using GTmetrix, this tab may contain varying amounts of data:
While you can analyze your website for free, GTmetrix Pro is also available. This Pro package includes additional features, such as resource usage graphs, hourly monitoring, and unlimited custom filters for your reports. The various Pro packages also offer priority access, so your reports will be generated before people who are using the unregistered and Basic plans.
Tips for Speeding Up Your Website
Managing a successful website is a lot of work. Not only do you have to install frequent updates, but you also have to fix slow loading times before they ruin the user experience.
To boost performance, you should always remove add-ons (such as plugins and themes) that you no longer use, as these files tend to take up a lot of space. For the tools that you do decide to keep, it’s important to ensure that you’re always running the latest versions. For similar reasons, you should ensure that whatever platform you’re using to run your website is up to date.
Other key performance-enhancing tips include:
In addition, you may want to consider whether it’s time to upgrade your web hosting. A hosting plan that’s not fast enough or doesn’t offer sufficient resources can bog down your site, no matter how many optimizations you implement.
If you’re still on a shared hosting plan, we’d recommend upgrading to a Virtual Private Server (VPS). These plans are still highly affordable, and offer the enhanced performance and scalability you’ll need to keep your website running fast at all times.
Conclusion
For best practices, you’ll want to monitor your site’s performance regularly to ensure that your web pages are displaying properly and loading consistently. This is also the best way to recognize which elements are slowing down your site, so you can make improvements as needed.
Let’s recap the three top platforms for evaluating website performance:
- Google PageSpeed Insights: A great option for measuring a page’s loading speed, based on real-time performance scores
- Pingdom: Makes it easier to collect web analytics, with a combination of synthetic and real-time monitoring to assess your visitors’ experience
- GTmetrix – Find out why your website is slow by getting all the details in a scheduled report, sent straight to your email.
Is your website running sluggishly? Our VPS hosting plans can help!
Image credit: PublicDomainPictures.


